Abundant CO2 in the disk around GW Lup as probed by JWST-MIRI
The inner 10 au of protoplanetary disks are regions of rich and active chemistry and this chemistry will impact the composition of exoplanets formed there. Spitzer-IRS made great strides in characterizing the chemistry in this region and now, with the sensitivity and spectral resolution of JWST-MIRI, we are able to constrain the content and conditions in the disk better than ever before. The increased sensitivity allows us to characterize fainter sources and detect weaker emission lines, and the increased spectral resolution allows us to study line profiles — which help constrain the gas properties — and de-blend lines from multiple species in spectra that are rich in emission features.
The disk around T Tauri star GW Lup was observed with Spitzer-IRS and Pontoppidan et al. 2010 and Salyk et al. 2011 find particularly strong CO2 emission. JWST-MIRI data, taken as part of the MIRI mid-INfrared Disk Survey (MINDS) GTO program, confirmed the strong CO2, but also showed emission from H2O, C2H2, HCN, OH, and the carbon dioxide isotopologue 13CO2. The detection of 13CO2 is the first gas-phase detection in a protoplanetary disk and indicates an abundant reservoir of CO2. Relative to the bright CO2 emission, the water emission is relatively faint. We suggest that this may be due to the disk around GW Lup being fairly cold or the presence of a small (~ 1 au) gap in the inner disk, which would remove some water but leave abundant CO2. This work was accepted to the Astrophysical Journal Letters in March 2023 and is available here. A press release on this paper and another from the MINDS program is available here. The GW Lup spectrum is publicly available to view and download here!
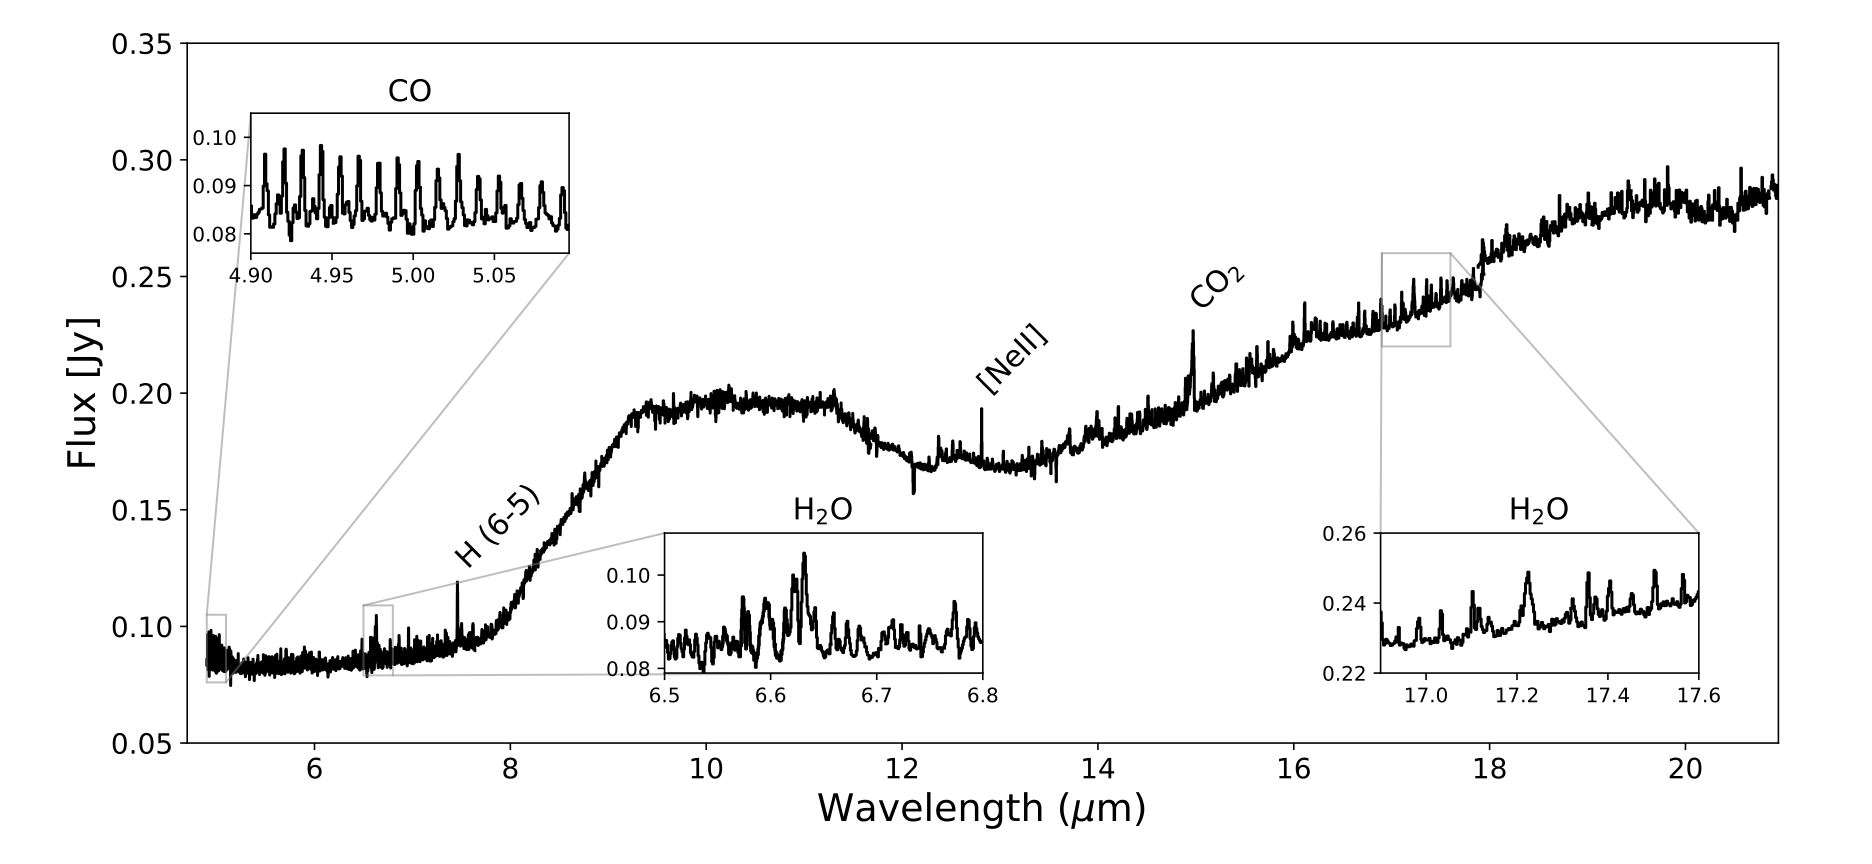
Top: The JWST-MIRI spectrum of the disk around GW Lup. Several prominent features are highlighted and noted. Bottom: The JWST-MIRI data (black) compared to a model (red) composed of emission from multiple molecular species, including 13CO2. Figures from Grant et al. 2023. An interactive version of the bottom figure is available here (click the molecules on the right-hand side of the page to see how they contribute to the observed spectrum).
 Top: The JWST-MIRI spectrum of the disk around GW Lup. Several prominent features are highlighted and noted. Bottom: The JWST-MIRI data (black) compared to a model (red) composed of emission from multiple molecular species, including 13CO2. Figures from Grant et al. 2023. An interactive version of the bottom figure is available here (click the molecules on the right-hand side of the page to see how they contribute to the observed spectrum).